bar chart — bar charts N COUNT A bar chart is a graph which uses parallel rectangular shapes to represent changes in the size, value, or rate of something or to compare the amount of something relating to a number of different countries or groups. [mainly… … English dictionary
bar chart — n. BAR GRAPH * * * … Universalium
bar chart — also bar graph n a picture of boxes of different heights, in which each box represents a different amount or quantity … Dictionary of contemporary English
bar chart — bar′ chart n. sta bar graph … From formal English to slang
bar chart — (also bar graph) ► NOUN ▪ a diagram in which different quantities are represented by rectangles of varying height … English terms dictionary
bar chart — n. BAR GRAPH … English World dictionary
Bar Chart — [engl.], Balkendiagramm … Universal-Lexikon
bar chart — noun a chart with bars whose lengths are proportional to quantities • Syn: ↑bar graph • Hypernyms: ↑chart • Hyponyms: ↑histogram * * * noun Etymology: bar ( … Useful english dictionary
Bar chart — See also: Histogram Example of a bar chart, with Country as the discrete data set. A bar chart or bar graph is a chart with rectangular bars with lengths proportional to the values that they represent. The bars can be plotted vertically or… … Wikipedia
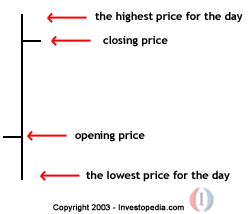
bar chart — A chart that graphs the high, low, and settlement prices for a specific trading session over a given period of time. Chicago Board of Trade glossary A graphic representation of price movement disclosing the high, low, close, and sometimes the… … Financial and business terms